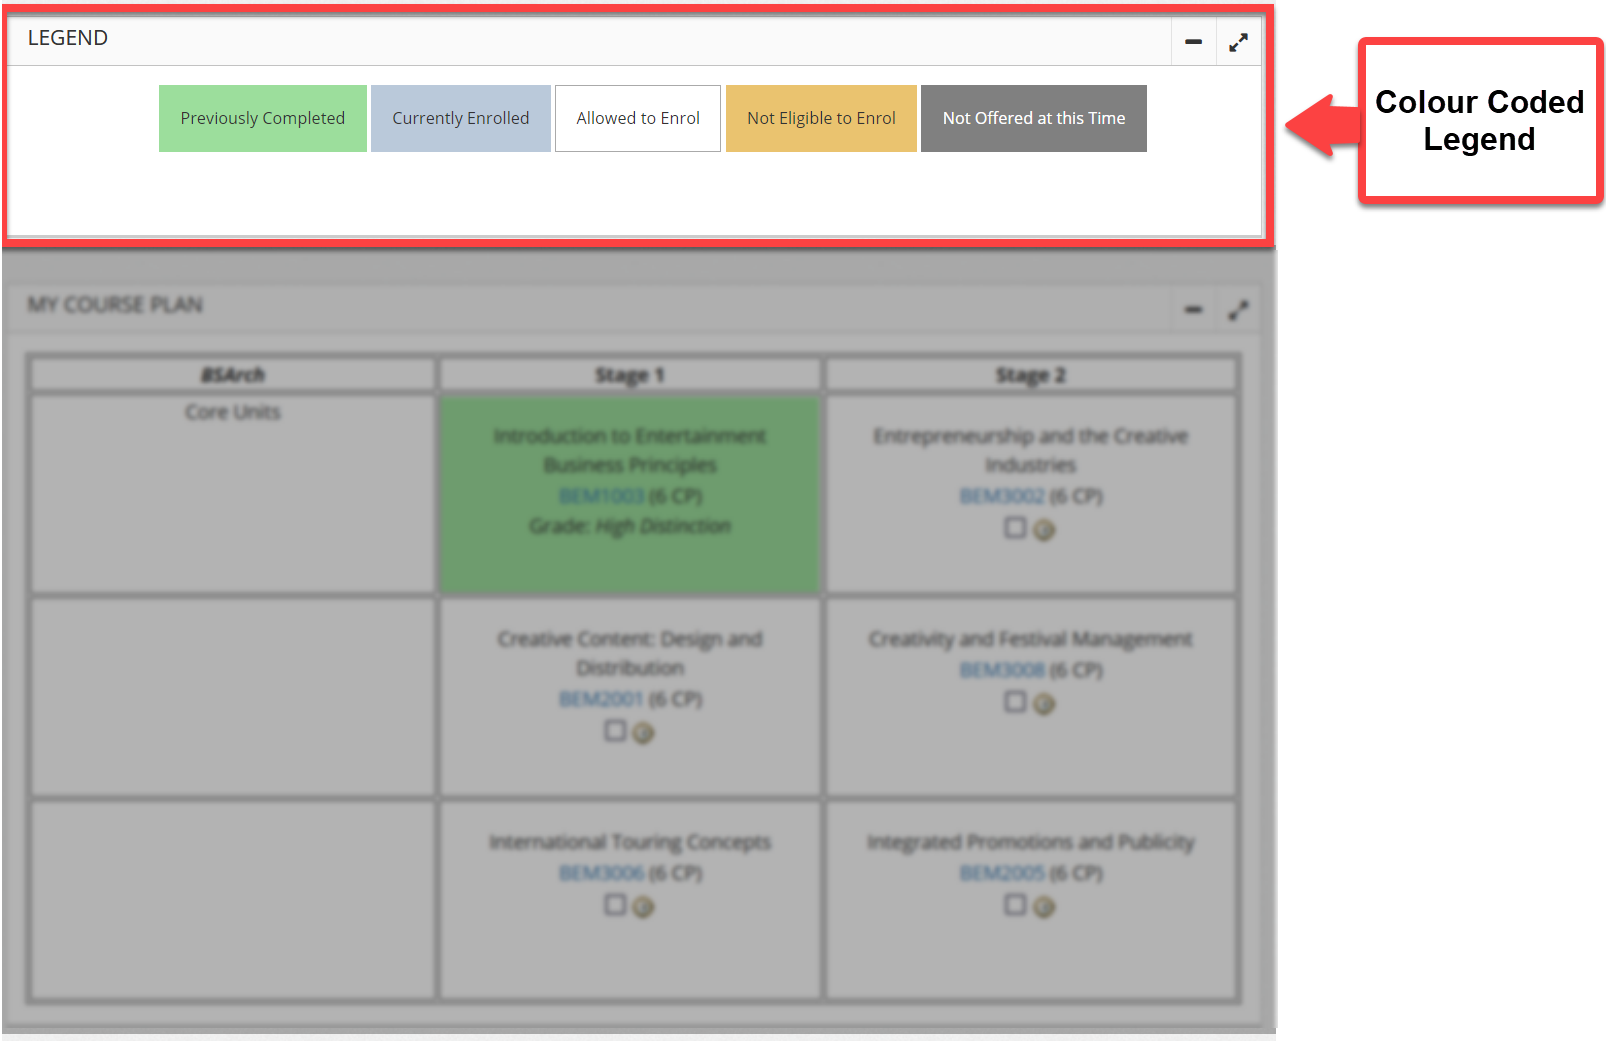
Grid Positioning
Last updated
Last updated
This article is an overview of how the Course Plan Interface works, the key terms and concepts that are crucial to designing your outline, and some sample outline coding with an example of how that coding will appear:
NOTE:
The Student Course Plan grid is visible to students at all times while still retaining the business logic around when a student is eligible to perform online Unit Enrolment. Students can see more information in a read-only state.
How to display your units in the Student's Course Plan screen?
If you have read all the introductions related to the Course Outline in the Course Outline Basics page, all the units (constraints) that have been coded on the Courses > Outline page, will have some of the possible Display Code values, as shown in this screenshot.
Example
In the Student Course Enrolment Screen (Student > Course Enrolment > Course Plan) view, students can see all the units available for them to complete their course in table format (as shown in the sample screenshot); the two units highlighted in RED below show their grid positions.
While logged in as an administrator, the Course Outline screen (Courses > Outline) view shows Screenshot 2 as an example of a course that already has an existing outline; and
an example screen of Screenshot 3, for a course that does not yet have a defined outline.
On your screen as an administrator, you will see a column named Display Code with the sample values of A1, B2, A3, etc. This indicates where you wish the scheduled unit or subject to be shown on the student Course Plan page.
This works the same way as an EXCEL spreadsheet: so for the unit name ID
BEM1001 (A1), it appears in the Stage 1 column (column A) in (Row 1) the first row of the student course planβs table, and
BEM1002 (B2), it appears in the Stage 2 column (column B) in row 2.
On the Student Course Plan page (Student > Course Enrolment > Course Plan), Paradigm colour-codes the units that are included in the course to help students and administrators to easily identify which units are available and allowable to enrol. The Course Plan allows staff members to enrol students into units, and it allows students to enrol themselves into units with ease.
Colour
Meaning
The student has previously completed this unit. Units with this colour would normally contain the Grade Outcome the student was awarded for the completed unit.
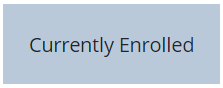
The student is currently enrolled in this unit. Units with this colour will also contain the equivalent Credit Points.
Unit is not available because prerequisites have not been met. Prerequisite units should be completed before these units become available for enrolment. This also includes that the Unit may have been set by other constraints that make the unit not eligible for the Student to enrol.
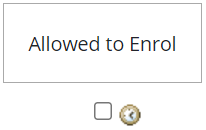
White
Unit can be selected for enrolment. Units with this colour will also contain the Session Times that are available for the student to choose from (if there are other available session times offered).
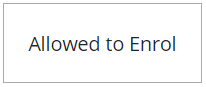
White
Unit has been scheduled, student meets prerequisites, but the enrolment period has not yet opened, and students are prevented from enrolling in the unit. Note: Staff member needs to double check the configuration time period called βUNIT_ENROLMENTβ.
Unit is not scheduled for the next enrolment period. This rule overrides the Orange rule where a prerequisite has not been met, i.e. when a prerequisite has not been met and the unit has not yet been scheduled, the unit will be shown in a grey cell.
The Course Plan is a grid that is restricted to a maximum of 9 columns across the screen, denoted by columns A through I (the first through to the ninth English letters), usually representing the passage of time by semester or trimester.
The grid is restricted to a maximum of 25 rows down the screen representing the type of unit to be studied. The rows are grouped based on a shared description, so for the units to appear nicely aligned and ordered along a row and in columns across the screen, then the description needs to be exactly the same for the units to be shown on that row.
These column and row length restrictions are in place to prevent the containing grid structure from becoming unwieldy on devices with smaller display screens. Examples are shown below.
Paradigm has a maximum display of 25 rows (as discussed above).
The table in the Course Plan screen works like a spreadsheet where columns are labelled as A, B, C, etc., while rows are numbered. Each grid position (or cell in Excel) is defined in the Display Code field when you add a new unit (constraint) on the Courses Outline (Courses > Outline) page. For more details on how these work refer to the next page article: Add Core and Elective Units. In the sample screenshot below, the Display Code values are the following: for the BEM1003 unit which is under the Stage 1 column and in the first row would have an A1 value, while BEM3002 would be B1, the next row would have the same column values with an incremented row number, e.g. A2 B2, A3 B3, A4 B4, etc.
Paradigm has a maximum display of 9 (A-I) columns (as discussed above).
In the sample screenshot below, BEM1003 has a Display Code value of A1 as mentioned above, and since all the units under this belong to the same column Stage 1 (Column 1) we will still use the A-value and just increment the number to match the row location, in this case, BEM2001 would have an A2, and BEM3006 would have an A3 value in the Display Code field. The next column would have the letter B and then the row number value. Since Paradigm only supports 9 columns, the column value ends at the letter I.
For all other grid positions in the table, the concept is the same. It depends on how you organise the units or constraints on the Courses Outline page. In the example below, since the unit is under the Stage 3 column, which is the second column from the Course column, and itβs on the third row, its grid position or Display Code value is B3.
Green
Blue
Orange
(with π² )
(without π²)
Grey